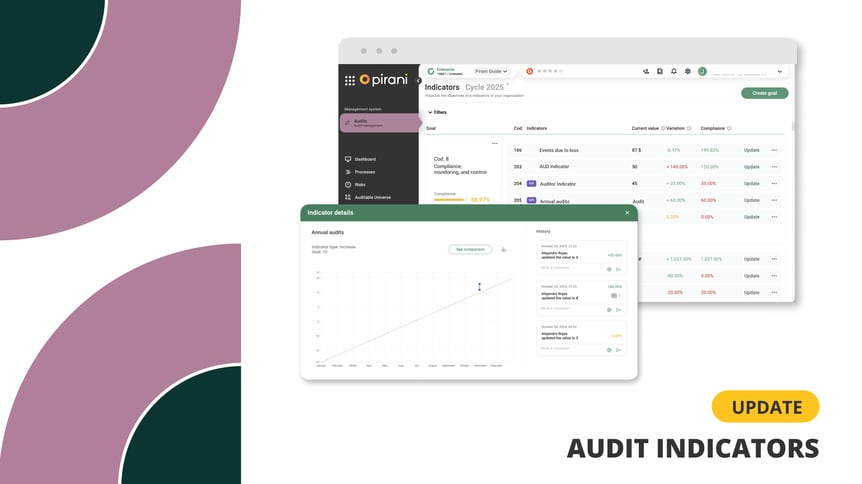
Measurement is key to ensuring the effectiveness of any audit process. In Pirani, the Indicators module allows you to monitor performance, control efficiency, and the fulfillment of strategic objectives associated with your audits and other management systems.
With the module’s latest update, you can now manage your KRI, KPI, and KCI indicators not only for ORM, ISMS, AML, and Compliance systems but also for Audits, integrating critical information for monitoring and continuous improvement in one place.
What is it and what is it used for?
The Indicators module enables audit teams to measure, monitor, and evaluate the performance of the organization’s processes, risks, and controls.
With Pirani, you can create KCI, KRI, and KPI indicators for all management systems or maintain a dedicated list for each one.
Types of indicators:
- KRI (Key Risk Indicators): Measure exposure to identified risks by assessing probability and impact.
- KPI (Key Performance Indicators): Measure the performance of processes and strategic objectives.
- KCI (Key Control Indicators): Evaluate the effectiveness of implemented controls to mitigate risks.
What benefits and advantages does it bring to the organization?
Integrating indicators into audit management provides tangible benefits:
- Complete visibility: All indicators and objectives centralized in a single dashboard.
- Data-driven decision-making: Clear information on risks, controls, and strategic performance.
- Continuous monitoring: Periodic updates for both manual and automatic indicators.
- Continuous improvement: Identification of improvement areas and performance patterns.
- Transparency: Historical records for each objective and indicator.
What problems does it help solve?
The Indicators module is designed to address common challenges in audit management:
- Lack of follow-up: Enables real-time monitoring of objectives and indicators.
- Information fragmentation: Consolidates data from different systems and processes.
- Difficulty in performance evaluation: Provides clear, comparable metrics across periods.
- Manual report generation: Reduces the time required to compile and analyze data.
How does it work?
Creating objectives
-
Go to the Indicators module and click “Create Objective.”
-
Complete the following fields:
-
Objective name
-
Description
-
Responsible person
-
Annual cycle
-
-
Save the objective. You can reorder, deactivate, or reactivate it at any time.
Creating indicators
Manual:
-
Record business data (clients, errors, availability, etc.).
-
Define the category, unit, target, baseline, frequency, and responsible person.
Automatic:
-
Calculated based on records from process, risk, and control modules.
-
The platform automatically updates indicators according to the defined frequency.
Updating and managing
-
Update: Change the current value and add comments.
-
Edit: Modify any field.
-
Delete: Remove indicators that are no longer needed.
- Detail: View the history and comparisons with previous years; download reports in PDF format.
Practical use cases
- Risk monitoring: Track KRIs to assess exposure to critical risks.
- Process improvement: Evaluate KCIs to ensure control effectiveness.
- Strategic performance: Use KPIs to measure objective fulfillment and support decision-making.
- Executive reporting: Generate customized reports for audit committees and management.
Are you already using the Indicators module in Auditing?
Discover here how to create indicators in our Help Center modules.
Try it now!
Don’t have the Enterprise plan? Schedule a demo with our sales team!


Risk-Management Milestones in the US 2025
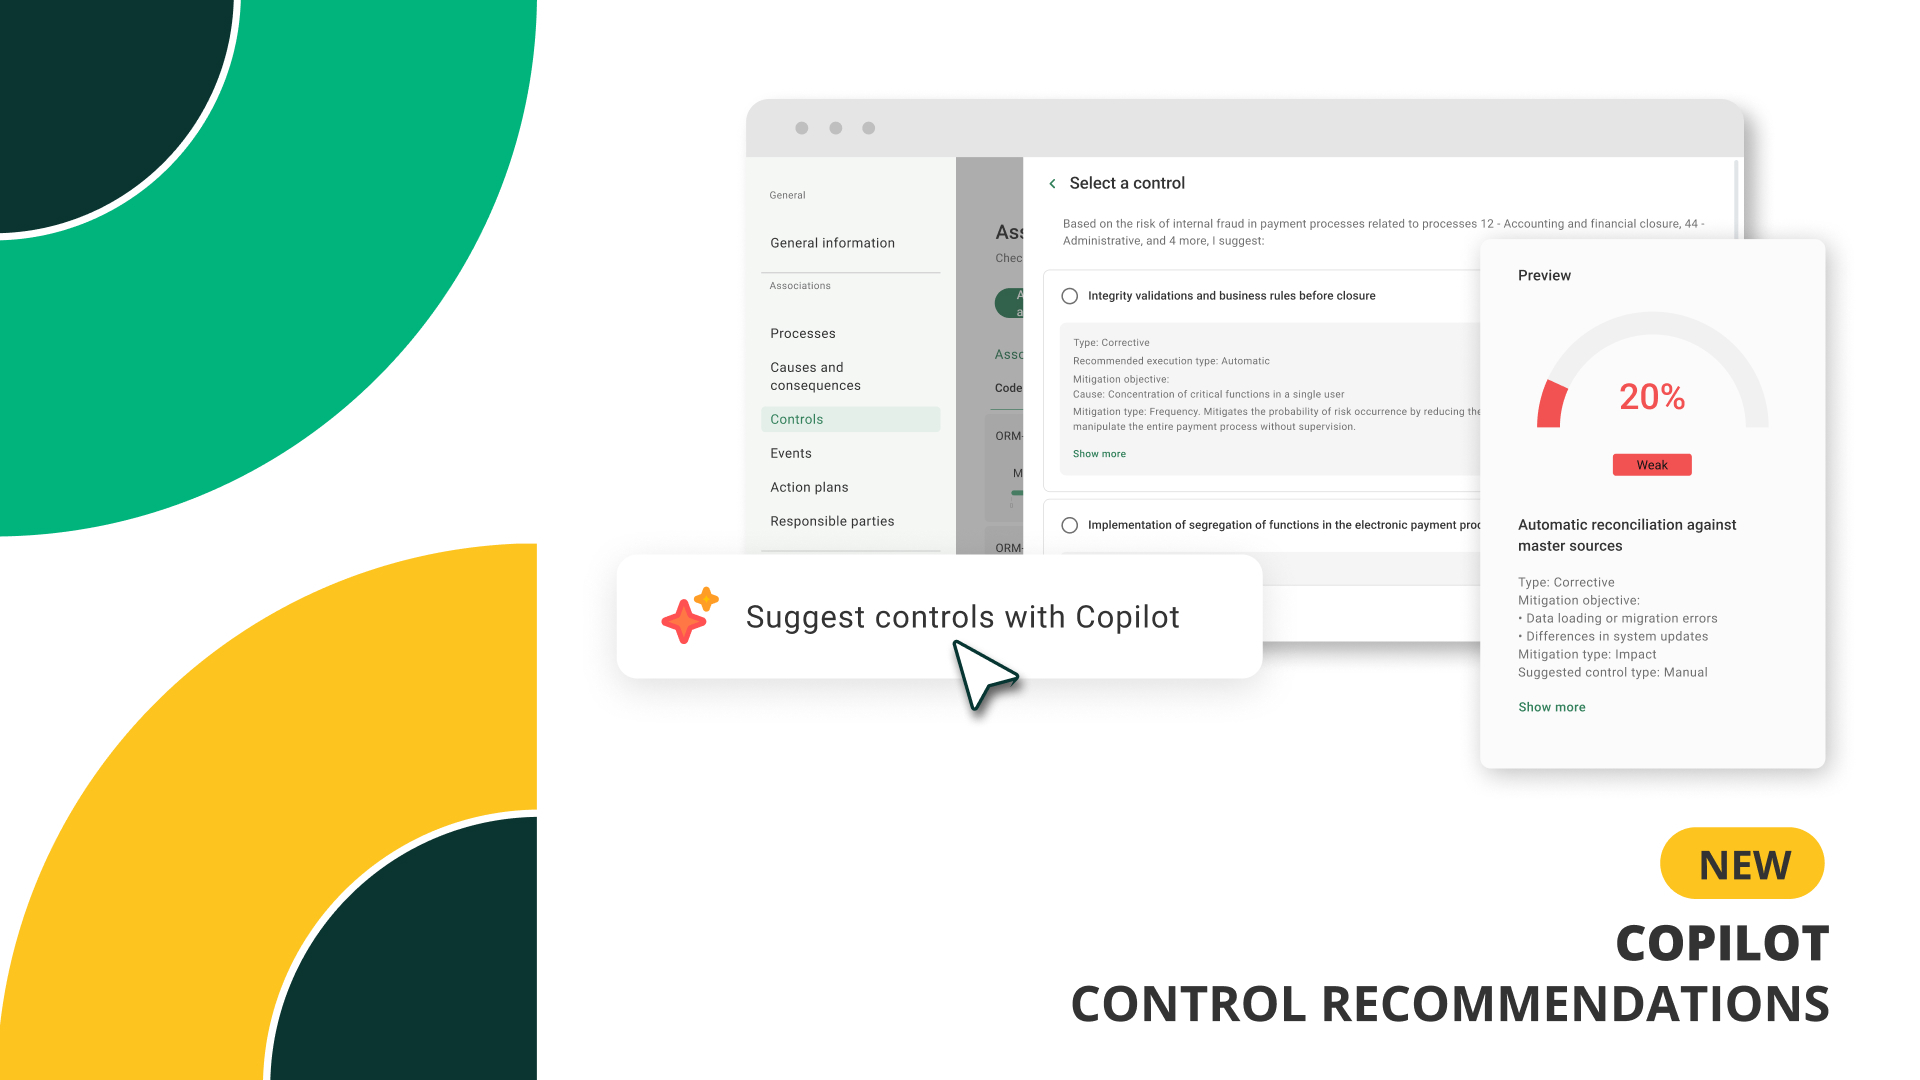
How Pirani Copilot automatically creates controls based on risks

Key Elements of AML Risk Management
.webp)
Quantitative Risk Assessment: More Precision, Less Subjectivity

Complete Guide: How to Successfully Manage Operational Risk

No Comments Yet
Let us know what you think